Alerts

-
4 minutes, 9 seconds
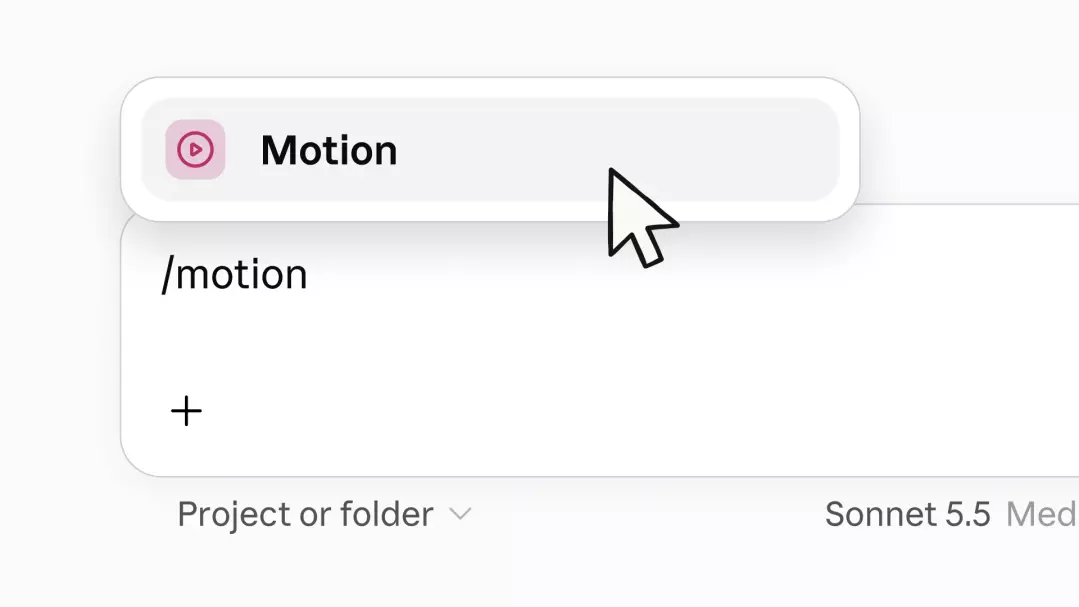
Claude can now turn data into animated explainers. Users can ask Anthropic’s AI chatbot to incorporate motion into its output, creating a 30-second video explainer. The animation plays like a short video and can be downloaded as an MP4 file, a video format that lets users save the result for later use.
This adds motion to Claude’s outputs, rather than limiting them to static content. A static result stays still on screen, while an animated result can use movement to present information. For example, a user can ask for an animated explainer based on data, or request movement in a chart. Claude can also create a product walkthrough, presenting it as a short video.
The result is designed to be viewed as an animation and saved for later use: the video can be downloaded as an MP4. These options let users ask Claude to present information in motion, whether they want a short explainer, an animated chart, or a walkthrough of a product. In practice, a user can specify the kind of presentation they want, ask Claude to add motion, then view the animation and download the video file.
Claude can add motion to its output, including animated charts and product walkthroughs. You can ask the chatbot to make a product walkthrough or add animation to a chart, turning the result into a short video-style presentation. A chart is a way to display data; adding animation means the information is presented with movement rather than only as a still image. A product walkthrough, meanwhile, presents a product in an explanatory format.
Animations play like short videos and can be downloaded as MP4 files. That means a chart can move beyond a static display, while a walkthrough can present a product in an animated format. Anthropic says Claude can also create a 30-second video explainer, offering another way to put motion into its output. Someone who wants to use one of these options can ask Claude for the relevant format, review the resulting animation, and save it as an MP4 file.
Anthropic is also rolling out live dashboards that update based on a company’s data. Unlike the animated explainers, charts, and product walkthroughs described alongside the feature, these dashboards are designed to refresh as the company’s data changes. A dashboard is a display of information, and the live aspect means its content can update instead of remaining a one-time snapshot.
That means the information they display can stay current rather than being limited to a one-time snapshot. The announcement describes the dashboards in broad terms: they update based on company data. It does not specify which data sources they connect to, how frequently they refresh, or what controls users have over the information shown. These limits matter for readers assessing whether the dashboards suit their needs: the announcement confirms the general purpose, but not the details of connections, update schedules, or controls.
The rollout is happening alongside Anthropic’s launch of Docs, Slides, and Design out of beta. Together, these updates bring live company-data dashboards into the same broader set of Claude-related product changes, while keeping the dashboard’s key distinction clear: its content updates based on a company’s data. People interested in the dashboards should note that the announcement gives no further details about their operation.
Anthropic is launching Docs, Slides, and Design out of beta, alongside its rollout of live dashboards that update based on company data. Leaving beta means these products are being presented as outside their beta stage; the announcement does not provide more information about what that transition changes. The announcement places the three products in a broader set of changes to Claude, which can now add motion to its output.
Users can ask the chatbot to create a 30-second video explainer, animate a chart, or make a product walkthrough, with animations playing like short videos that can be downloaded as MP4 files. The same announcement also names live dashboards that update based on company data. Together, the named additions cover animated presentations and changing data displays, alongside Docs, Slides, and Design.
The source announcement does not detail what has changed in Docs, Slides, or Design as they leave beta, or describe specific features in those products. It does, however, name all three as part of the rollout. The other announced addition is live dashboards that update based on a company’s data. Together, the updates span documents, presentations, design, data dashboards, and animated explainers, though the announcement provides no further details about availability or how the products work. Readers can choose what to explore based on their needs: ask Claude for a moving explainer, chart, or walkthrough, or look to the named document, presentation, design, and dashboard updates while recognizing that the announcement does not explain their specific features or availability.









Comment