Alerts

-
4 minutes, 7 seconds
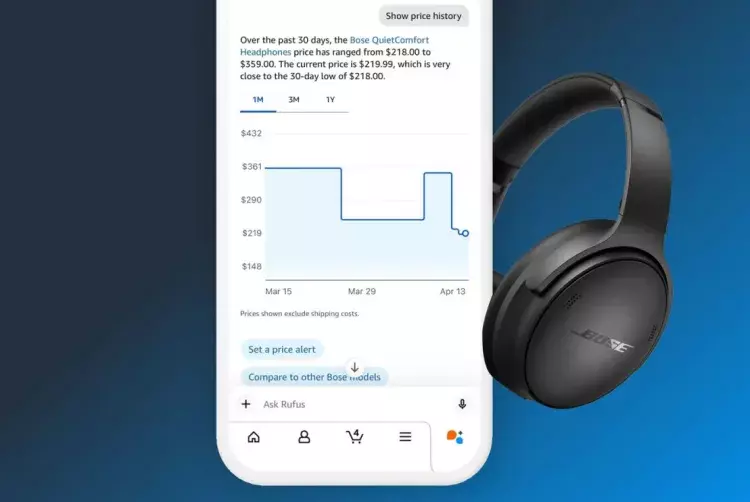
Amazon has quietly upgraded its built-in AI price history tool to now display price changes for the entire past year. This means when you shop on Amazon, you can see exactly how a product’s price has moved over 12 months—helping you decide if now is the right time to buy or if you should wait for a better deal.
Amazon’s AI price history is a feature that shows a graph of a product’s price over time. Previously, it only showed data for a few months. Now, it covers a full year, giving you a clearer picture of price trends.
To see the price history on a product page:
This expansion helps you avoid overpaying. For example, if you see a product’s price is currently high compared to its lowest point in the past year, you might wait for a drop. Conversely, if the price is near its yearly low, it could be a smart time to buy.
Imagine you want to buy a popular blender. The price history shows it was $50 six months ago, then jumped to $80, and now sits at $70. You can see the pattern and guess that it might drop back to $50 during a sale event like Prime Day.
Here are simple tips to make the most of Amazon’s AI price history:
Not entirely. Tools like Keepa or CamelCamelCamel still offer more detailed data, such as historical lows over several years. However, Amazon’s built-in feature is now much more useful for casual shoppers who want a quick, no-fuss view.
This update suggests Amazon is investing in transparency. In the future, we might see even longer histories or personalized price predictions using AI. For now, this one-year view is a big step forward for bargain hunters.
Amazon’s expanded AI price history makes it easier to shop smart. Next time you’re about to buy something, take 10 seconds to check the graph. It could save you money and help you avoid buyer’s regret.










Comment